Exploratory Data Analysis (EDA)
Repository · Notebook

Subscribe to our newsletter
📬 Receive new lessons straight to your inbox (once a month) and join 40K+ developers in learning how to responsibly deliver value with ML.
Intuition
Exploratory data analysis (EDA) to understand the signals and nuances of our dataset. It's a cyclical process that can be done at various points of our development process (before/after labeling, preprocessing, etc. depending on how well the problem is defined. For example, if we're unsure how to label or preprocess our data, we can use EDA to figure it out.
We're going to start our project with EDA, a vital (and fun) process that's often misconstrued. Here's how to think about EDA:
- not just to visualize a prescribed set of plots (correlation matrix, etc.).
- goal is to convince yourself that the data you have is sufficient for the task.
- use EDA to answer important questions and to make it easier to extract insight
- not a one time process; as your data grows, you want to revisit EDA to catch distribution shifts, anomalies, etc.
Let's answer a few key questions using EDA.
1 2 3 4 5 | |
Tag distribution
How many data points do we have per tag? We'll use the Counter class to get counts for all the different tags.
1 2 3 | |
[('natural-language-processing', 310),
 ('computer-vision', 285),
 ('other', 106),
 ('mlops', 63)]
We can then separate the tags and from their respective counts and plot them using Plotly.
1 2 3 4 5 6 7 8 | |
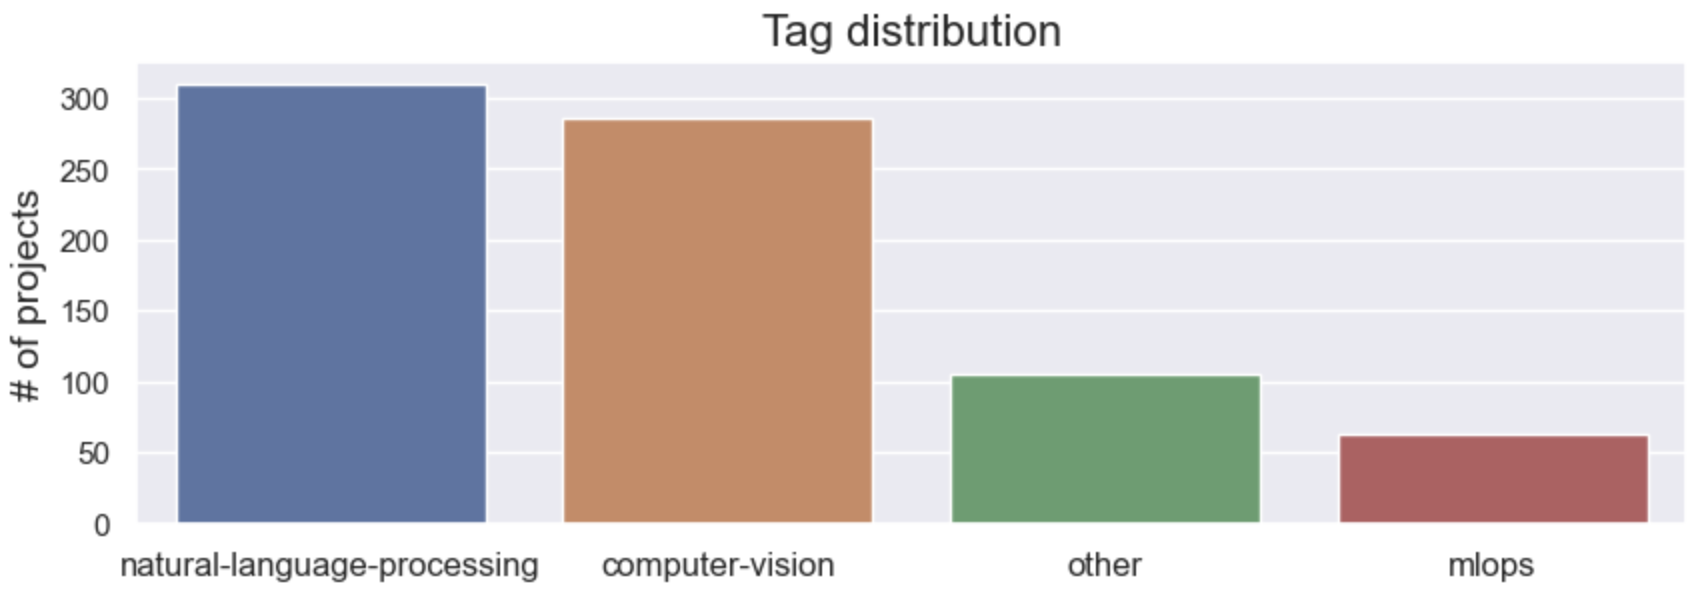
We do have some data imbalance but it's not too bad. If we did want to account for this, there are many strategies, including over-sampling less frequent classes and under-sampling popular classes, class weights in the loss function, etc.
Wordcloud
Is there enough signal in the title and description that's unique to each tag? This is important to know because we want to verify our initial hypothesis that the project's title and description are high quality features for predicting the tag. And to visualize this, we're going to use a wordcloud. We also use a jupyter widget, which you can view in the notebook, to interactively select a tag and see the wordcloud for that tag.
1 2 3 4 5 6 7 8 9 10 | |
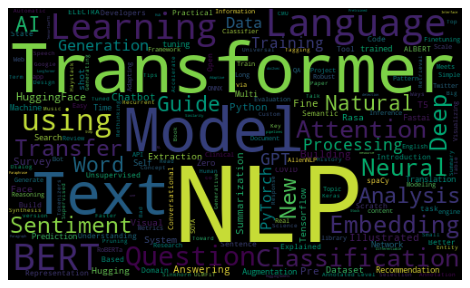
Looks like the title text feature has some good signal for the respective classes and matches our intuition. We can repeat this for the description text feature as well and see similar quality signals. This information will become useful when we decide how to use our features for modeling.
There's a lot more exploratory data analysis that we can do but for now we've answered our questions around our class distributions and the quality of our text features. In the next lesson we'll preprocess our dataset in preparation for model training.
Upcoming live cohorts
Sign up for our upcoming live cohort, where we'll provide live lessons + QA, compute (GPUs) and community to learn everything in one day.
To cite this content, please use:
1 2 3 4 5 6 | |