Dashboard

Subscribe to our newsletter
📬 Receive new lessons straight to your inbox (once a month) and join 40K+ developers in learning how to responsibly deliver value with ML.
Intuition
When developing an application, there are a lot of technical decisions and results (preprocessing, performance, etc.) that are integral to our system. How can we effectively communicate this to other developers and business stakeholders? One option is a Jupyter notebook but it's often cluttered with code and isn't very easy for non-technical team members to access and run. We need to create a dashboard that can be accessed without any technical prerequisites and effectively communicates key findings. It would be even more useful if our dashboard was interactive such that it provides utility even for the technical developers.
Streamlit
There are some great tooling options, such as Dash, Gradio, Streamlit, Tableau, Looker, etc. for creating dashboards to deliver data oriented insights. Traditionally, interactive dashboards were exclusively created using front-end programming languages such as HTML Javascript, CSS, etc. However, given that many developers working in machine learning are using Python, the tooling landscape has evolved to bridge this gap. These tools now allow ML developers to create interactive dashboards and visualizations in Python while offering full customization via HTML, JS, and CSS. We'll be using Streamlit to create our dashboards because of it's intuitive API, sharing capabilities and increasing community adoption.
Set up
With Streamlit, we can quickly create an empty application and as we develop, the UI will update as well.
# Setup
pip install streamlit==1.10.0
mkdir streamlit
touch streamlit/app.py
streamlit run streamlit/app.py
You can now view your Streamlit app in your browser.

  Local URL: http://localhost:8501
  Network URL: http://10.0.1.93:8501
This will automatically open up the streamlit dashboard for us on http://localhost:8501.
Be sure to add this package and version to our
requirements.txtfile.
API Reference
Before we create a dashboard for our specific application, we need to learn about the different Streamlit components. Instead of going through them all in this lesson, take a few minutes and go through the API reference. It's quite short and we promise you'll be amazed at how many UI components (styled text, latex, tables, plots, etc.) you can create using just Python. We'll explore the different components in detail as they apply to creating different interactions for our specific dashboard below.
Sections
We'll start by outlining the sections we want to have in our dashboard by editing our streamlit/app.py script:
1 2 3 4 5 6 | |
1 2 3 4 5 6 7 | |
To see these changes on our dashboard, we can refresh our dashboard page (press R) or set it Always rerun (press A).
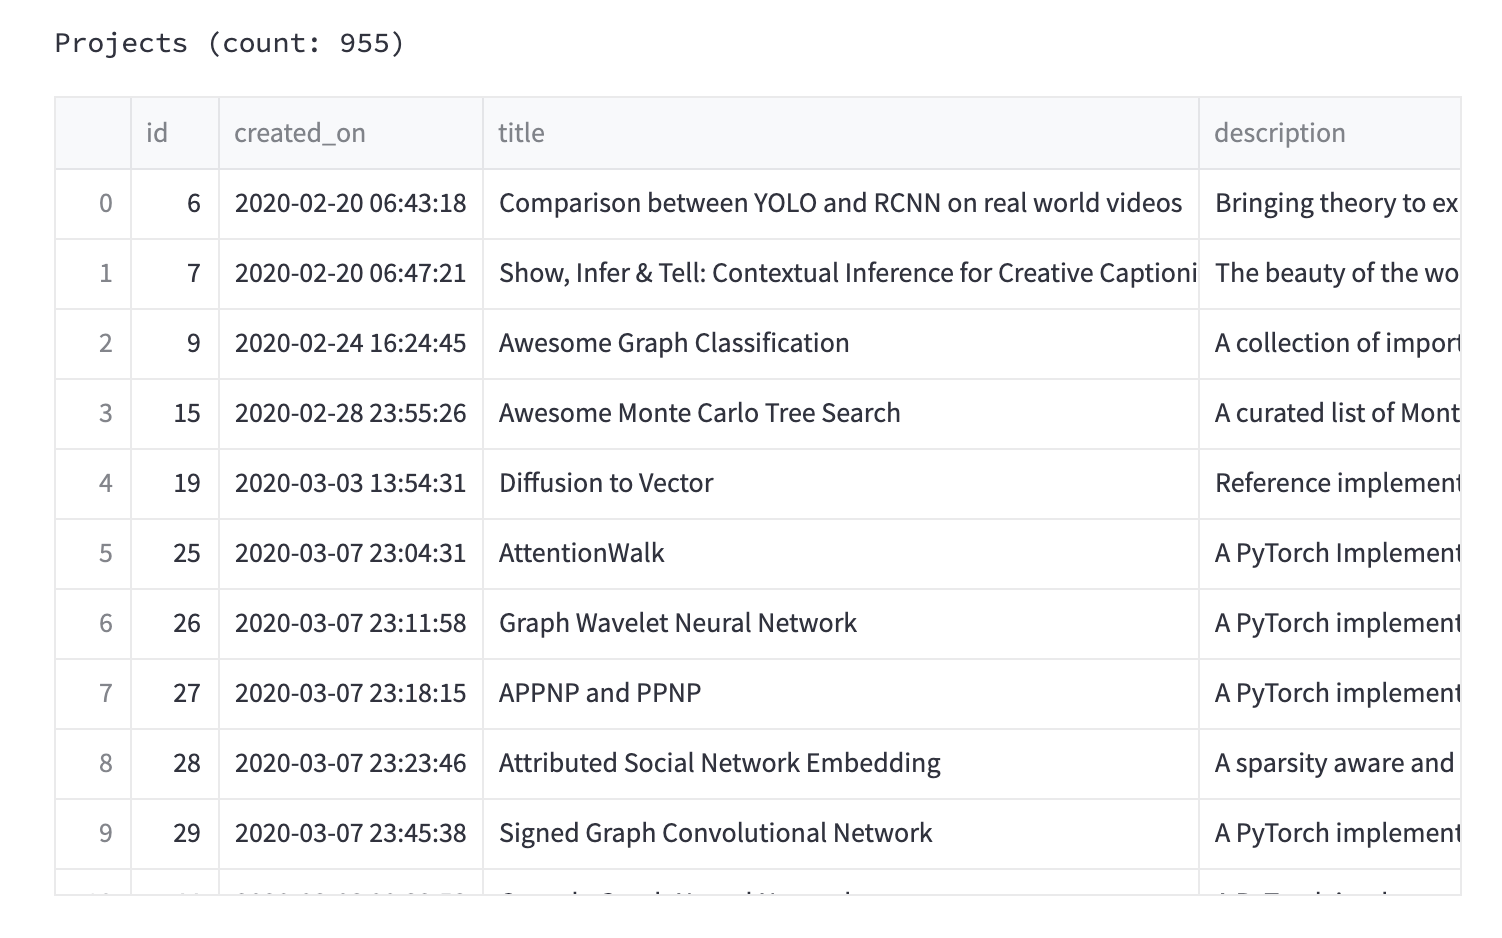
Data
We're going to keep our dashboard simple, so we'll just display the labeled projects.
1 2 3 4 5 | |
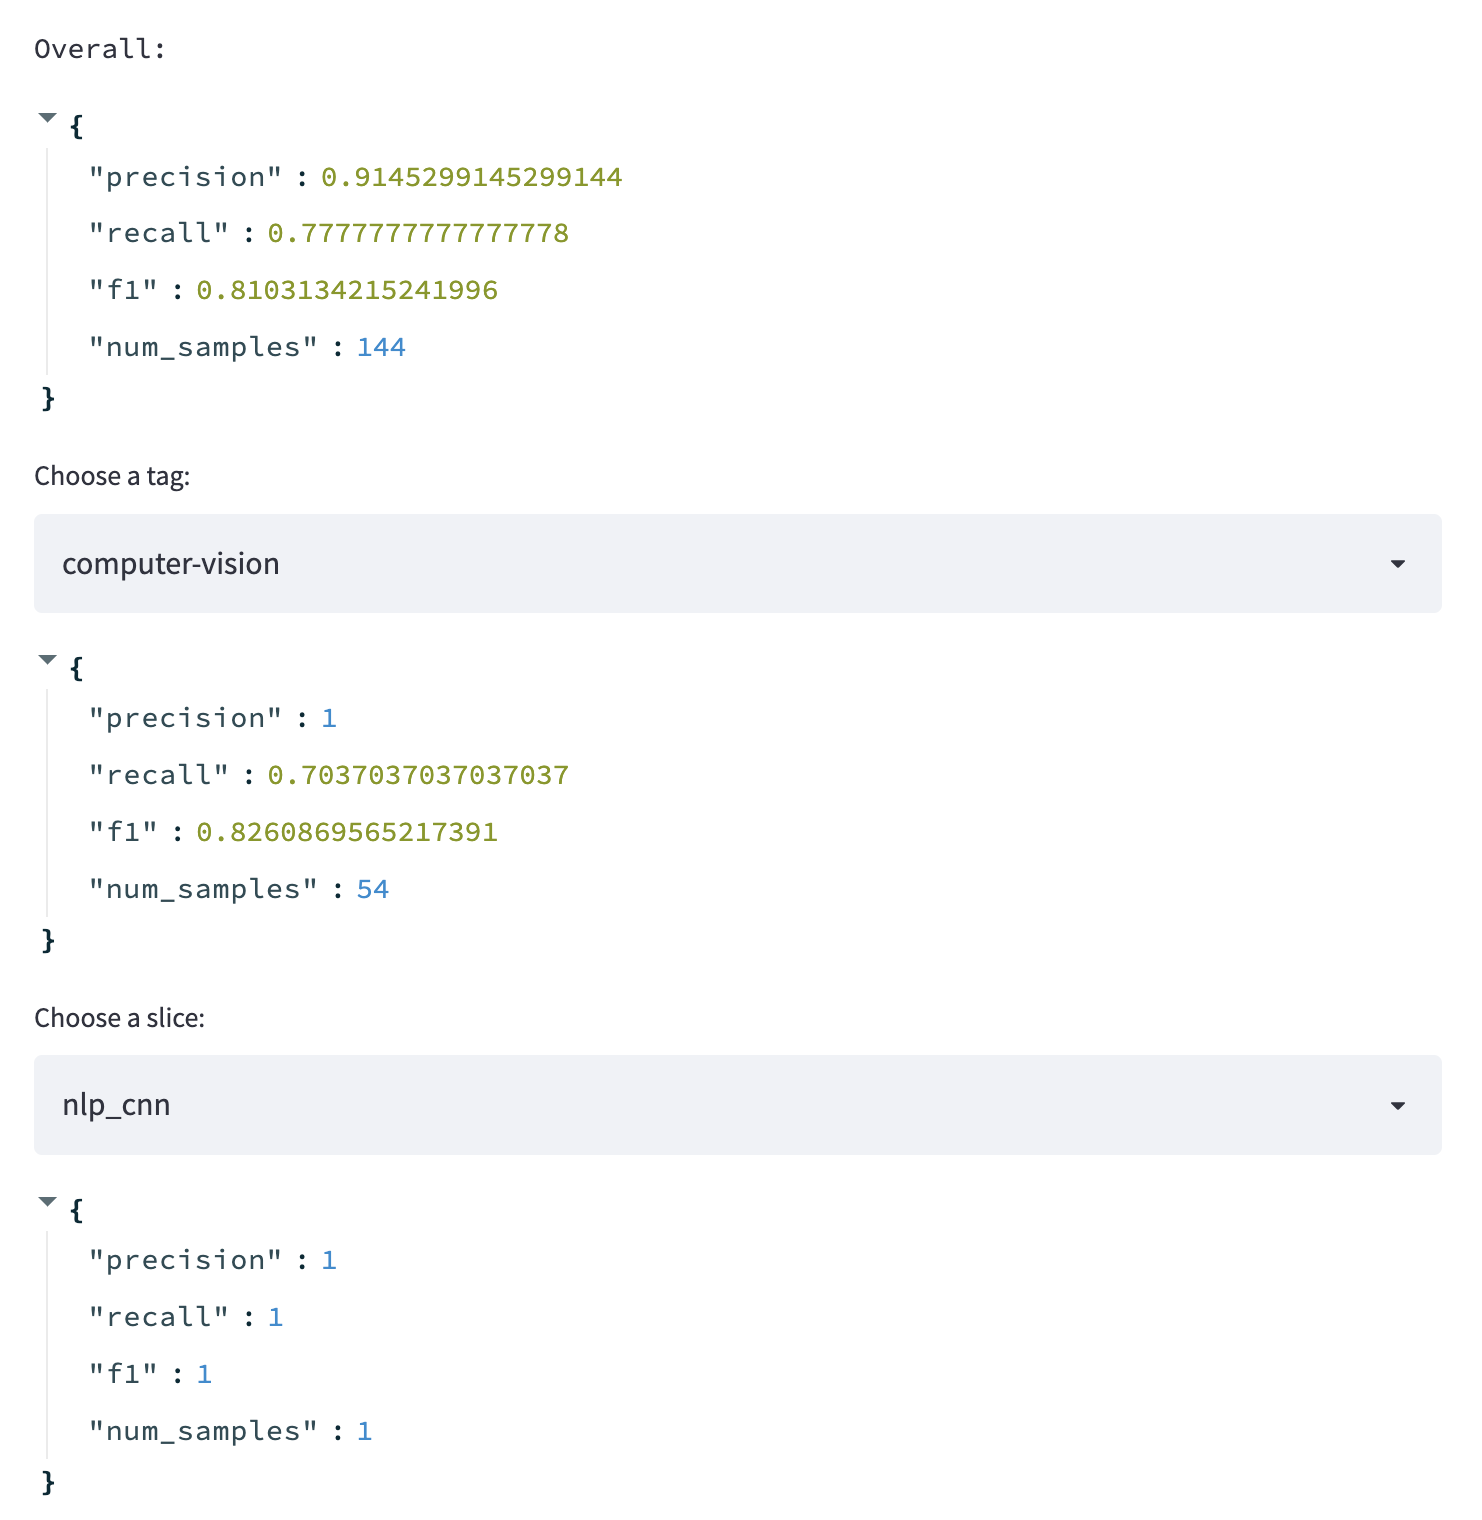
Performance
In this section, we'll display the performance of from our latest trained model. Again, we're going to keep it simple but we could also overlay more information such as improvements or regressions from previous deployments by accessing the model store.
1 2 3 4 5 6 7 8 9 | |
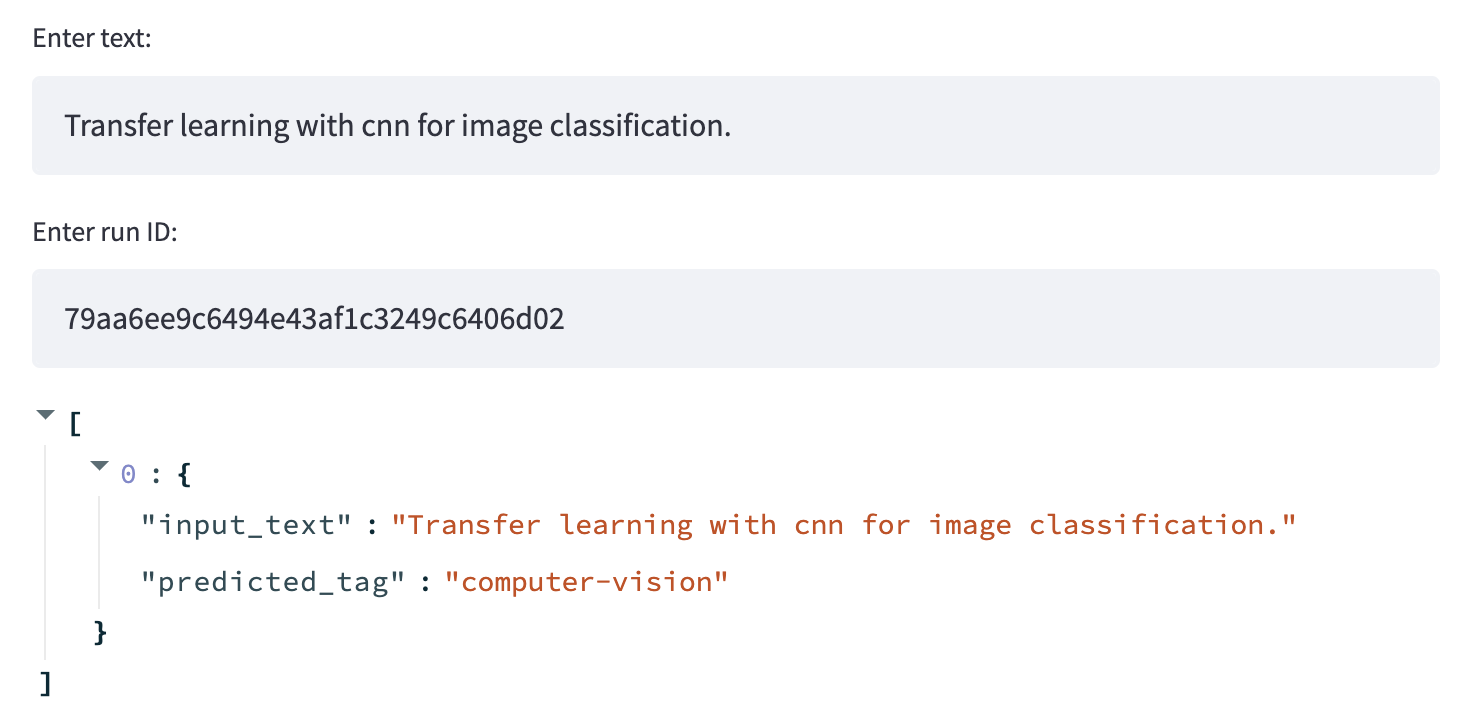
Inference
With the inference section, we want to be able to quickly predict with the latest trained model.
1 2 3 4 5 | |
Tip
Our dashboard is quite simple but we can also more comprehensive dashboards that reflect some of the core topics we covered in our machine learning canvas.
- Display findings from our labeling, EDA and preprocessing stages of development.
- View false +/- interactively and connect with annotation pipelines so that changes to the data can be reviewed and incorporated.
- Compare performances across multiple releases to visualize improvements/regressions over time (using model store, git tags, etc.)
Caching
Sometimes we may have views that involve computationally heavy operations, such as loading data or model artifacts. It's best practice to cache these operations by wrapping them as a separate function with the @st.cache decorator. This calls for Streamlit to cache the function by the specific combination of it's inputs to deliver the respective outputs when the function is invoked with the same inputs.
1 2 3 4 5 | |
Deploy
We have several different options for deploying and managing our Streamlit dashboard. We could use Streamlit's sharing feature (beta) which allows us to seamlessly deploy dashboards straight from GitHub. Our dashboard will continue to stay updated as we commit changes to our repository. Another option is to deploy the Streamlit dashboard along with our API service. We can use docker-compose to spin up a separate container or simply add it to the API service's Dockerfile's ENTRYPOINT with the appropriate ports exposed. The later might be ideal, especially if your dashboard isn't meant to be public and it you want added security, performance, etc.
Upcoming live cohorts
Sign up for our upcoming live cohort, where we'll provide live lessons + QA, compute (GPUs) and community to learn everything in one day.
To cite this content, please use:
1 2 3 4 5 6 | |